
Imagine this: You’re at the helm of a thriving company, metrics flashing green across your dashboard. EBITDA is soaring, investors are cheering, and everything seems golden. Then, out of nowhere, payroll bounces, suppliers demand upfront payments, and your cash reserves evaporate like dew in the morning sun. Sound familiar? It’s a tale as old as business itself—chasing the allure of EBITDA only to be blindsided by the harsh reality of cash flow shortages.
In the fast-paced world of finance, EBITDA (Earnings Before Interest, Taxes, Depreciation, and Amortization) often gets paraded as the ultimate measure of operational success. But as Oana Labes, MBA, CPA, brilliantly illustrates in her viral infographic (shared below), EBITDA isn’t cash flow—and mistaking it for one can spell disaster for even the most promising enterprises. This article dives deep into the nuances of these financial metrics, unpacking why they differ, the pitfalls of over-relying on EBITDA, and actionable strategies for mastering true liquidity. Whether you’re a CEO, CFO, or aspiring entrepreneur, understanding this distinction could be the key to sustainable growth.
(Infographic courtesy of Oana Labes, MBA, CPA. Follow her on LinkedIn for more finance wisdom.)
What Is EBITDA, and Why Do Leaders Love It?
EBITDA has become a staple in boardrooms and earnings calls for good reason. It’s a non-GAAP (Generally Accepted Accounting Principles) metric that strips out non-operating expenses like interest, taxes, depreciation, and amortization from net income. The result? A cleaner snapshot of a company’s core operational profitability, free from the distortions of financing decisions, tax strategies, or asset write-downs.
For instance, if your business earns $1 million in net income but has $200,000 in depreciation, $150,000 in interest, and $100,000 in taxes, your EBITDA would clock in at $1.45 million. It’s straightforward, comparable across industries, and often used by investors to value companies—think multiples like EV/EBITDA in mergers and acquisitions.
But here’s where the romance sours: EBITDA is an accrual-based figure. It records revenues and expenses when they’re earned or incurred, not when cash actually changes hands. This makes it a great tool for assessing operational efficiency, but a poor proxy for liquidity. As Labes points out, leaders often misuse it to justify decisions on loan repayments, dividend distributions, or expansion plans—areas where actual cash availability reigns supreme.
Breaking Down Cash Flow: The Real Hero of Business Survival
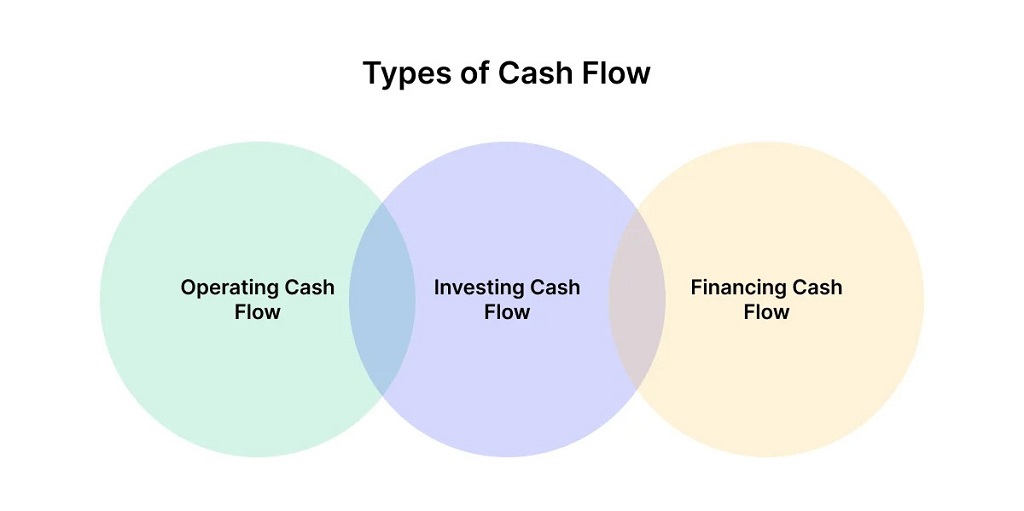
Unlike EBITDA, cash flow metrics focus on the cold, hard movement of money in and out of your business. Let’s dissect the key types highlighted in the infographic:
Operating Cash Flow (OCF)
This is the cash generated from your core business operations. Starting from net income, OCF adds back non-cash items like depreciation and amortization, then adjusts for changes in working capital—such as increases or decreases in accounts receivable (AR), accounts payable (AP), and inventory.
Formula: Net Income + Depreciation/Amortization + Changes in Working Capital (e.g., Decreases/Increases in AR/AP/Inventory) + Other Adjustments
Why it matters: OCF reveals whether your day-to-day operations are truly cash-positive. A company with stellar EBITDA might still bleed cash if customers delay payments (inflating AR) or if inventory piles up unsold.
Free Cash Flow (FCF)
Taking OCF a step further, FCF subtracts capital expenditures (CAPEX)—the investments in long-term assets like equipment or property. It’s essentially the cash left over after maintaining or expanding your asset base.
Formula: Operating Cash Flow – CAPEX
FCF is a favorite among investors because it shows how much cash is available for dividends, debt reduction, or reinvestment without borrowing. If EBITDA ignores CAPEX, FCF brings it front and center, highlighting sustainability.
Free Cash Flow to Equity (FCFE)
This metric refines FCF by accounting for financing activities, adding net borrowings (new debt minus repayments). It’s particularly useful for equity holders, as it indicates cash available for shareholders after all obligations.
Formula: Free Cash Flow + Net Borrowings
In essence, while EBITDA paints a rosy picture of earnings potential, these cash flow variants ground you in reality. They factor in the ebbs and flows of working capital management, tax payments, interest obligations, and investment needs—elements that can make or break your financial health.
The Dangers of EBITDA Obsession: Real-World Pitfalls
Relying solely on EBITDA can lead to perilous blind spots. Consider the case of WeWork, the co-working giant that once boasted sky-high EBITDA multiples during its hype phase. Investors poured in billions, dazzled by adjusted profitability figures. Yet, underlying cash flow issues—massive lease commitments treated as off-balance-sheet and aggressive expansion without corresponding cash inflows—contributed to its near-collapse in 2019. EBITDA masked the liquidity crunch, rewarding short-term growth tactics that eroded long-term viability.
Similarly, in manufacturing sectors, companies might defer maintenance to boost EBITDA, only to face hefty CAPEX bills later, draining cash reserves. Or in retail, aggressive discounting spikes revenue (and EBITDA) but locks cash in extended receivables, leading to working capital strains.
Labes nails it: EBITDA inflates perceived profitability while ignoring taxes, interest, and capital swings. Banks might underwrite loans based on EBITDA covenants, but your business survives on cash. This mismatch has felled many a startup and established firm alike, underscoring the need for a balanced financial dashboard.
Key Drivers of True Liquidity: Beyond the Metrics
To shift from EBITDA optics to cash flow mastery, focus on these pillars:
-
Revenue Growth with Cash Discipline
Top-line expansion is vital, but pair it with stringent credit policies. Implement early payment incentives or factoring for receivables to accelerate cash inflows. Avoid over-reliance on discounts that erode margins without boosting collections.
-
Scalable Operating Efficiency
High gross margins are great, but ensure selling, general, and administrative (SG&A) expenses and cost of goods sold (COGS) align with revenue fluctuations. Lean methodologies, like just-in-time inventory, can prevent cash from being tied up in excess stock.
- Working Capital Optimization
This is the linchpin. Monitor your cash conversion cycle (CCC): Days Sales Outstanding (DSO) + Days Inventory Outstanding (DIO) – Days Payable Outstanding (DPO). Aim to shorten DSO through better invoicing, optimize DIO by forecasting demand accurately, and extend DPO ethically with suppliers.
Tools like cash flow forecasting software or ERP systems can provide real-time insights, helping you anticipate shortfalls. Remember, every dollar stuck in working capital is a dollar not working for your growth.
How to Integrate EBITDA and Cash Flow for Smarter Decisions
The goal isn’t to ditch EBITDA—it’s to use it wisely. Leverage it for investor communications, benchmarking, or spotting operational trends. But for internal steering, prioritize cash flow statements. Conduct regular cash flow audits, scenario planning for economic downturns, and stress tests on liquidity ratios like the current ratio or quick ratio.
In mergers and acquisitions, blend both: Use EBITDA for valuation multiples, but scrutinize FCF for post-deal cash sustainability. For dividends or buybacks, ensure FCFE supports them without compromising operations.
By bridging these metrics, you’ll foster a culture of financial resilience, turning potential crises into opportunities.
Read More Also: How to File Your Taxes
Wrapping Up: Secure Your Business’s Financial Future
In the end, EBITDA is a spotlight on profitability, but cash flow is the lifeblood that keeps your business pumping. As Oana Labes reminds us, chasing the former at the expense of the latter is like building a castle on sand—impressive until the tide comes in. Arm yourself with this knowledge to make informed decisions that drive not just growth, but enduring success.
Ready to transform your financial strategy? Dive deeper by auditing your own cash flow today or consult a financial expert. Share your thoughts in the comments below—what’s your biggest cash flow challenge? Let’s discuss!
FAQs on EBITDA vs. Cash Flow
What is the main difference between EBITDA and cash flow?
EBITDA measures operational earnings excluding interest, taxes, depreciation, and amortization, focusing on accrual accounting. Cash flow, like operating cash flow or free cash flow, tracks actual cash movements, including working capital changes and CAPEX, providing a truer picture of liquidity.
Why do companies report EBITDA if it’s not cash?
EBITDA offers a standardized view of core profitability, useful for comparisons across companies or industries. It’s popular in valuations and earnings reports but shouldn’t replace cash flow analysis for operational decisions.
How can poor working capital management affect cash flow?
Inefficient working capital—such as slow collections or excess inventory—ties up cash, reducing liquidity even if EBITDA is strong. This can lead to borrowing needs or missed opportunities, impacting overall financial health.
Is free cash flow more important than EBITDA for investors?
It depends on context. EBITDA helps assess earning potential, while free cash flow indicates cash available for dividends, debt, or growth. Savvy investors review both alongside other metrics like net debt and return on invested capital.
How do I improve my business’s cash flow?
Focus on accelerating receivables, optimizing inventory, extending payables wisely, cutting unnecessary expenses, and forecasting regularly. Tools like QuickBooks or Xero can help track and predict cash positions effectively.